Numbers that show the scale and performance of the work.
We believe job-search support should be evaluated with clear measures. Here are the headline figures Robiq reports, with context about what each one represents.
Real proof, not a promise
Screenshots from our own interview log and client portal
Clients hired atMcKessonCyberMaxxTwilioJacobs
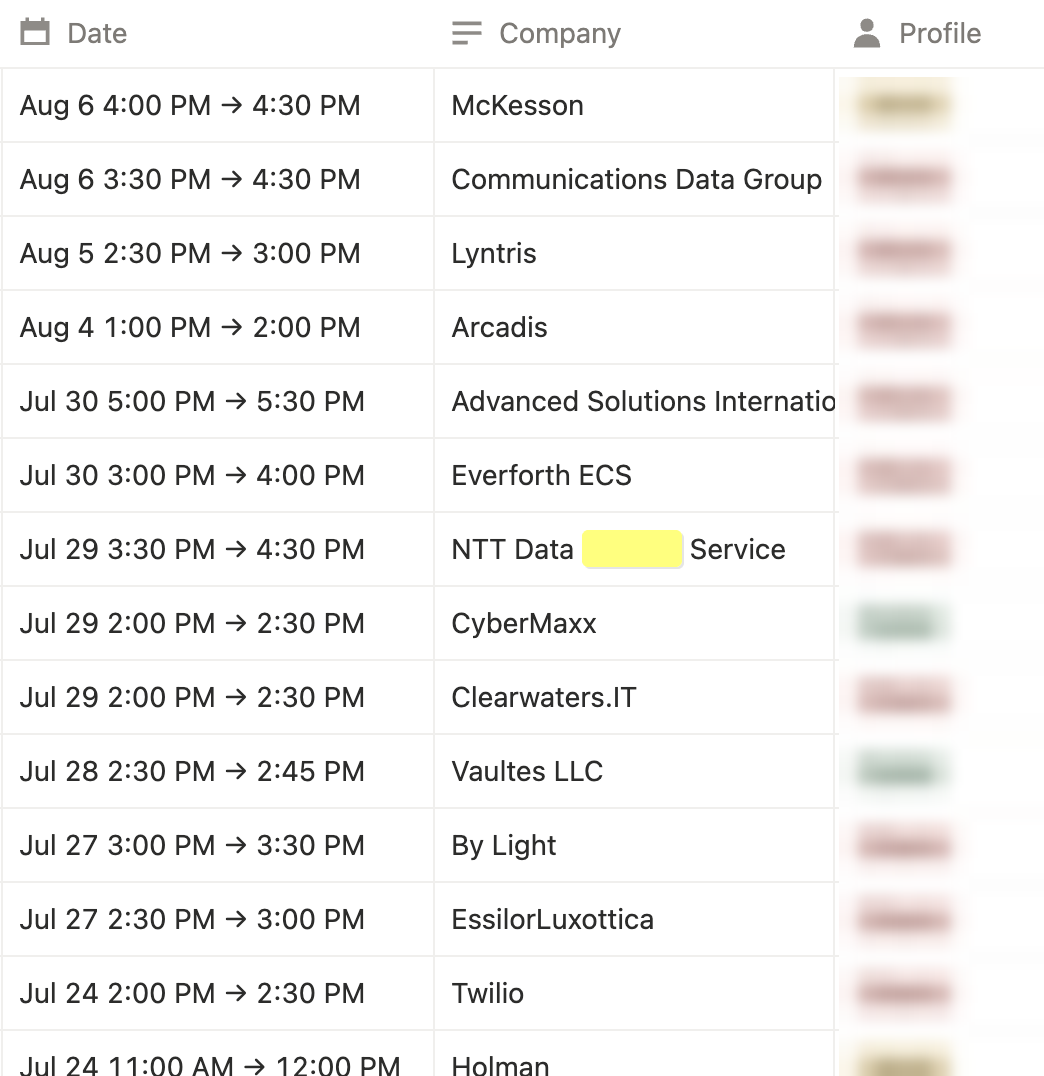
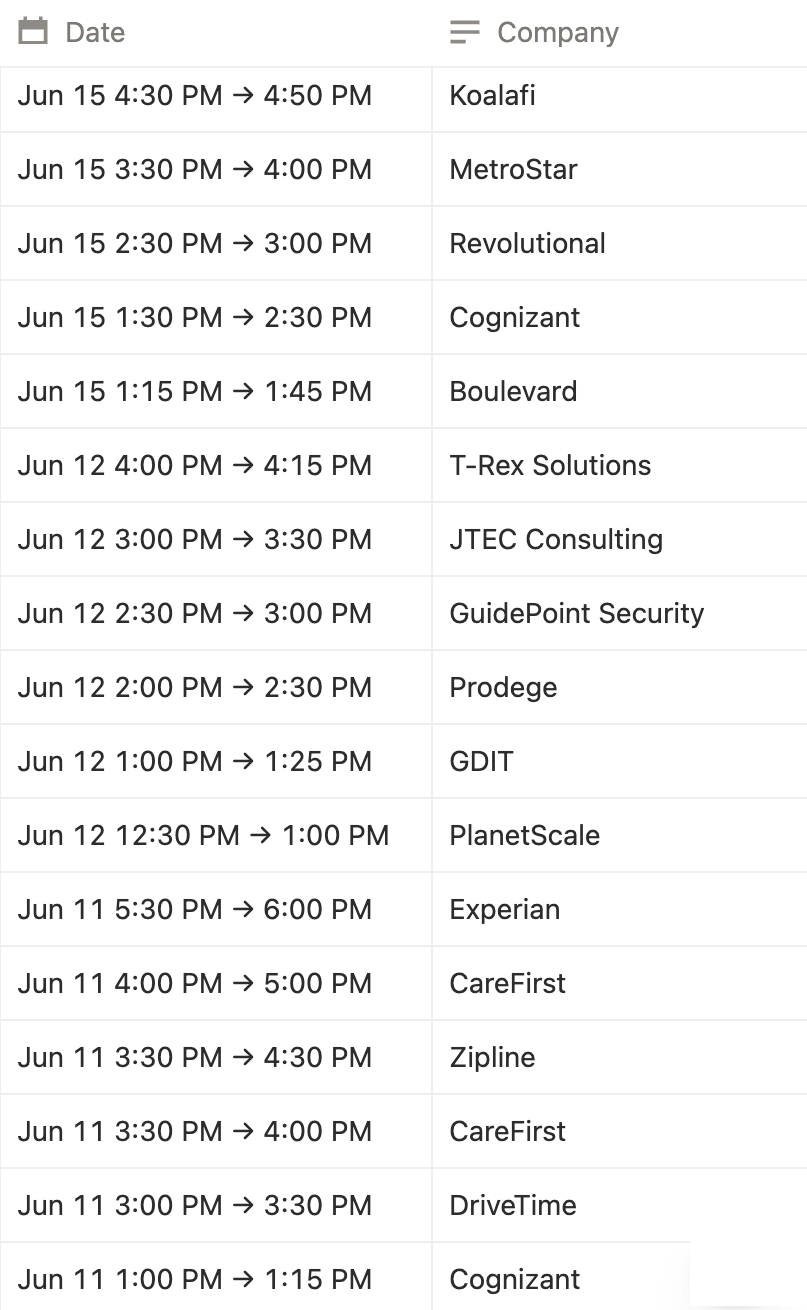
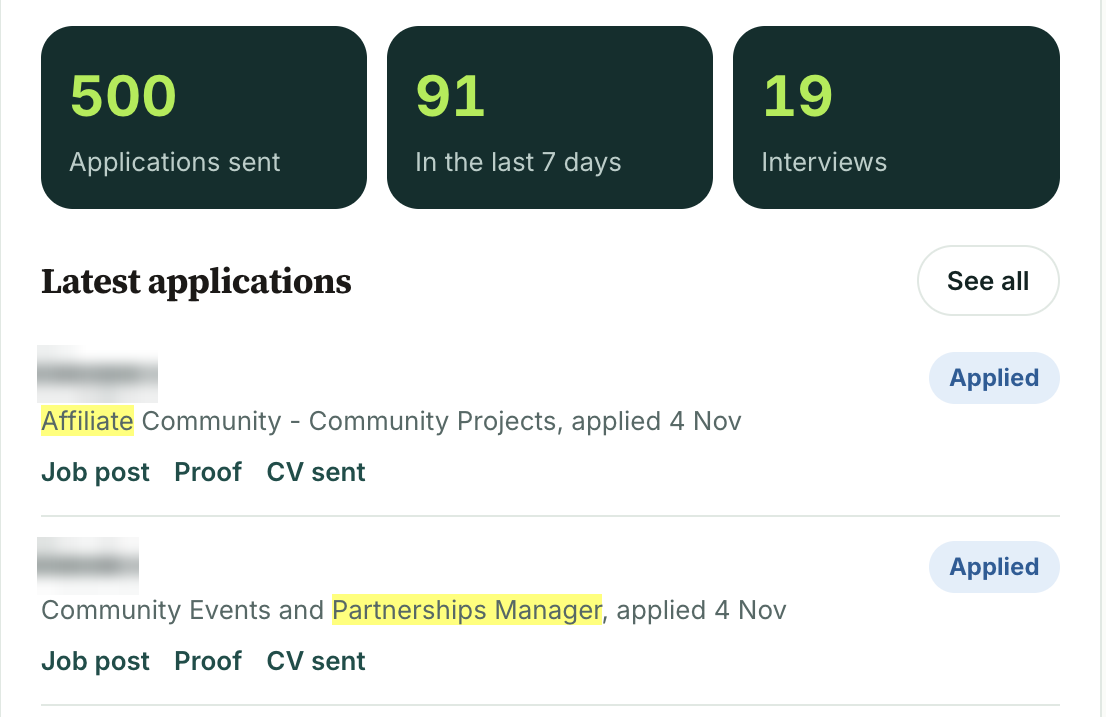
Unedited screenshots apart from the blurring. Past results, not a promise.
HOW TO READ THE 10%
Interview rate is the metric. Not a promise.
Robiq reports an aggregate interview rate of 10% per application. It describes historical overall performance across the work represented by the metric. It does not mean every client will receive an interview for every ten applications, and it is not a guarantee of an interview, job offer or hire.
WHAT WE MEASURE
Activity is only the starting point.
- 01Applications submitted
- 02Employer responses received
- 03Interview invitations and interviews
- 04Progress by target role and market
- 05Reasons roles are screened out
Evidence should always have the right context.
Some historical examples on this website relate to recruiting-agency work, not direct Robiq customers. We keep those categories separate and will only describe a result as a Robiq client outcome when it belongs to a Robiq client.
Meet the team →YOUR SEARCH, YOUR GOALS
Find out whether Robiq is right for you.
Talk through your target roles, markets and expectations with our team.
Book a free consultation →All figures on this page are supplied by Robiq. They are aggregate service figures and should not be interpreted as individual outcomes or a guarantee.